
As of July 28, 2026, Langfuse is our pick when traces, datasets, evaluations, and an open-source self-hosting route need to live in one product. LangSmith wins if LangChain or LangGraph already owns the application.
Phoenix fits a private OpenTelemetry stack. Braintrust fits evaluation-led development. Helicone fits gateway-first request monitoring. Datadog wins when the model is one service in an estate you already watch.
We reached that verdict from current first-party documentation, not from running the tools. We do not rank trace latency, ingestion throughput, evaluator accuracy, or support quality.
This is the observability and evaluation layer of the AI App Stack. No partner or sponsored links appear in this roundup. Inclusion and order follow documented product fit as it stood on the review date.
A trace without a test is a record of bad answers
A trace answers what happened. An evaluation answers whether the result was acceptable. A dataset makes that judgment repeatable, and an experiment tells you whether a prompt, model, retrieval step, or tool change improved the same cases. Buy a viewer and skip that loop, and you own a precise record of bad answers.
We checked five parts of each product's current first-party documentation:
| Decision | What we looked for | Why it changes the pick |
|---|---|---|
| Trace model | Nested model, retrieval, tool, and custom spans | A flat request log cannot explain an agent path |
| Evaluation loop | Offline datasets, production scores, human review, and experiment comparison | Visibility alone does not catch a quality regression |
| Instrumentation | SDKs, framework hooks, proxy paths, and OpenTelemetry support | Portable instrumentation lowers switching cost |
| Data boundary | Hosted, open-source, hybrid, or self-hosted deployment | Prompts and tool results can contain sensitive data |
| Cost shape | Seats, traces, observations, requests, data, scores, and infrastructure | The cheap starting plan may not match production volume |
The sources establish available features and published limits. They do not establish which interface is easier under incident pressure, which collector drops fewer spans at load, or which evaluator agrees most often with a domain expert. We would need the same instrumented application and labeled cases inside every product to make those claims.
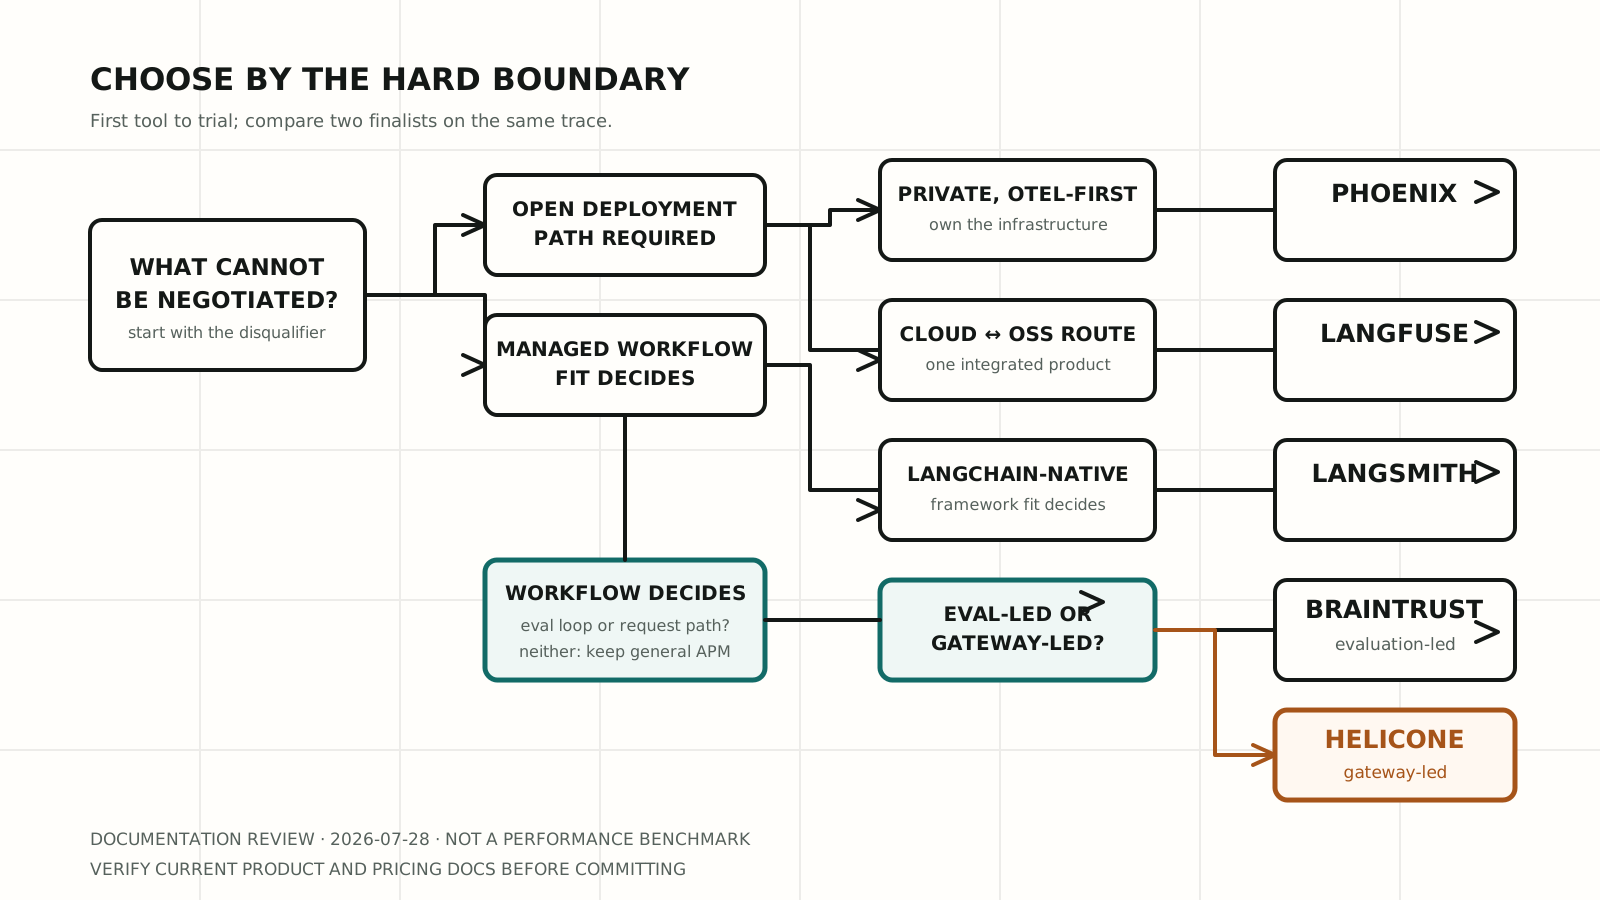
The map is a selection aid from published product boundaries, not a benchmark result. Start with the branch that can disqualify a tool, such as full open-source control or an existing LangGraph stack, before comparing dashboard details. It draws the five specialist products. Datadog enters one branch earlier, when the estate is already instrumented and the question is whether a specialist is needed at all.
Documentation is all we compared
| Tool | Best for | Ingestion path | Evaluation loop | Deployment boundary | Cost shape | Free starting route | Where it loses |
|---|---|---|---|---|---|---|---|
| Langfuse | Integrated tracing, prompts, datasets, and evals with cloud-to-OSS portability | OpenTelemetry-based Python and JS/TS SDKs; OTLP | Offline experiments plus code, model, API, and human scores | Cloud or MIT-licensed self-hosted core | Traces + observations + scores as billable units in Cloud | Hobby Cloud plan or self-hosted OSS | Version compatibility and self-hosted operations need active ownership |
| LangSmith | LangChain and LangGraph applications | Framework integrations, manual tracing, SDKs, and OpenTelemetry | Versioned datasets, offline experiments, and online evaluators | SaaS; enterprise self-hosted and hybrid options | Seat plus tracing and platform usage | Single-seat Developer plan | Less attractive when framework neutrality or open-source control is the priority |
| Phoenix | OpenTelemetry-first teams that want the full data path in their infrastructure | OTLP with OpenInference instrumentation | Code, model, and human evals over traces, datasets, and experiments | Open-source Docker, Kubernetes, or cloud deployment | Your infrastructure for OSS; separate hosted Arize plans | Self-hosted open source | One Phoenix instance is one tenant; production operations remain yours |
| Braintrust | A production-to-evaluation feedback loop | Braintrust SDKs and an OTLP endpoint | Logs and experiments share a structure; offline and online scoring | Hosted or customer-run data plane with a managed control plane | Processed data, scores, and plan features | Starter plan | The self-hosted option does not make the whole control plane open source or customer-run |
| Helicone | Request, session, cost, user, and gateway monitoring | AI gateway, proxy, SDK, or logging integrations | Datasets and externally produced scores | Hosted plans; enterprise on-premises option | Plan plus requests and storage | Hobby plan | Helicone documents that it stores scores but does not run evaluations for you |
| Datadog | LLM spans read beside the services and infrastructure around them | Datadog SDKs and API through the existing agent and tracing path | Managed quality and safety evaluations over spans | SaaS only, in a Datadog region | A platform SKU on top of an existing Datadog contract | Trial inside an existing account | No open-source or self-hosted route, and the dataset-experiment loop is thinner than the specialists |
We kept exact dollar figures and quotas out of the table because they change faster than the product boundary. Follow the linked Langfuse, LangSmith, Arize, Braintrust, Helicone, and Datadog pricing pages for the current numbers.
Langfuse is the integrated open path
Langfuse puts tracing, prompt management, datasets, experiments, and several evaluation methods in one product. Its evaluation concepts connect offline experiments to online scoring: a production failure can become a dataset item, and a later experiment can run the revised application against that case. Code evaluators, LLM-as-a-judge, API scores, UI scores, and annotation queues all write into the score model.
The deployment boundary is the reason it leads this list. Langfuse publishes its core product under the MIT license and documents self-hosted pricing separately from Cloud. Cloud billing counts traces, observations, and scores as billable units, which is clearer than pretending one request always equals one stored object.
Where it loses: open source removes a license bill, not an operations bill. A production deployment still needs databases, storage, upgrades, backups, and someone who reads compatibility notes. That last part matters in July 2026. The current version compatibility page marks Cloud v4 as generally available while saying the self-hosted v4 schedule will follow. A team adopting current SDK majors should check that matrix against its server before an upgrade.
Langfuse is our default shortlist when the team wants one evaluation loop and a credible route between managed Cloud and self-hosting. If the application is already deep in LangChain or the team will not operate observability infrastructure, the next two choices can be cleaner.
LangSmith is the LangChain-native pick
LangSmith has the shortest documented route from LangChain or LangGraph code to a useful trace. Its observability model groups runs into traces and supports framework integrations, manual instrumentation, tags, and metadata. The same platform adds versioned datasets and both offline and online evaluation.
That integration changes the amount of glue code a team owns. A failing production run can move into a dataset, receive code or model-based evaluators, and appear beside later experiments. OpenTelemetry ingestion is also available, so LangSmith is not limited to LangChain spans, but the tightest workflow still appears when the application already uses the LangChain product family.
Where it loses: the hosted starting path combines plan, seat, and usage decisions, while self-hosted LangSmith is an enterprise deployment with PostgreSQL, Redis, ClickHouse, and supporting services. It is not the same proposition as installing an MIT-licensed tool and owning every layer. For a small framework-neutral service, that can be more platform than the job needs.
Choose LangSmith when existing LangChain or LangGraph integration removes work you would otherwise build. Do not choose it merely because an agent tutorial already has the tracing environment variable in its final step.
Phoenix keeps the stack in your infrastructure
Phoenix is built on OpenTelemetry and OpenInference, and its current product overview covers traces, evaluations, prompt work, datasets, and experiments. It accepts model, retrieval, tool, and custom spans, then lets code, model-based, or human evaluators attach scores to traces and experiment results.
Its self-hosted shape is unusually concrete. The deployment architecture describes a web application, OTLP collector, and SQL backend. SQLite fits a local single-user start. PostgreSQL is the production option. Docker and Kubernetes deployment guides are public, and the privacy documentation says trace and evaluation data stays inside the operator's infrastructure when Phoenix is self-hosted.
Where it loses: a Phoenix instance represents one tenant. The current architecture recommends separate instances or database schemas for stronger team and environment isolation, so a large organization must design that boundary. Continuous monitoring and alerting also extend into the broader Arize AX product line rather than every feature living in Phoenix OSS.
Phoenix is our pick when keeping trace data in a private OpenTelemetry stack is the first requirement and the team is prepared to run it. It is not a free managed service disguised as a container.
Braintrust makes evaluation the product
Braintrust treats production observation and pre-release evaluation as one data problem. Its observability documentation says logs use the same structure as experiments, so teams can filter production traces, apply feedback, and turn selected failures into targeted datasets. The evaluation workflow covers offline experiments, online scoring, playground work, and regression checks.
This is the strongest fit when the organization's main question is not "where did the tokens go?" but "did this change improve the task?" Braintrust supports SDK instrumentation and OpenTelemetry export, which makes it possible to keep a broader trace graph while using the same spans in evaluation work.
Where it loses: its self-hosted deployment is a customer-run data plane, not a fully customer-run product. Sensitive traces, datasets, prompts, and experiment data stay in that plane, while Braintrust continues to provide the UI, authentication, metadata, and platform updates through its control plane. That split can satisfy a data-residency requirement, but it does not satisfy every full-isolation or open-source requirement.
Braintrust belongs on the shortlist when experiments and production feedback already drive releases. If the team mainly needs a request gateway and cost report, it starts too far down the evaluation stack.
Helicone is a request path, not a judge
Helicone's center of gravity is the request. Its gateway and logging paths expose models, tokens, costs, errors, users, custom properties, and sessions. The sessions documentation groups LLM calls, vector queries, tools, and other logged requests into a trace-like hierarchy, which is useful for multi-step agents that already pass through its gateway.
It also supports datasets and score storage, but the boundary is explicit. The current score documentation says Helicone does not run evaluations. Teams submit results from an evaluation framework or their own workers. Its older prompt Experiments feature was marked for removal in 2025. A team choosing Helicone for an evaluation lab should budget another system for the actual judges, test execution, and experiment comparison.
Where it wins is operational simplicity for gateway-first monitoring. A team that wants per-user cost, request filtering, rate limits, caching, provider fallbacks, and session inspection can get those concerns close to the API path. Where it loses is the extra seam between production traces and repeatable evals.
Use Helicone when the gateway is the product boundary you want to observe. Do not infer an evaluator from a score column.
Datadog wins the correlation question, not the evaluation one
Every other product here asks you to run a second observability system and reconcile two timelines during an incident. Datadog LLM Observability is the option that does not, because the model spans land in the same platform already holding your services, queues, databases, and hosts.
That matters at exactly one moment, and it is the moment that wakes people up. A p95 latency alarm fires. Somebody has to decide within a few minutes whether the provider slowed down, the retrieval database started swapping, a deploy changed the prompt, or a node got rescheduled. Answering that inside one trace view, with the alerting and on-call routing a team already trusts, is worth more than a richer evaluation product they open the next morning.
Datadog also documents managed quality and safety evaluations that score spans, so the category is present rather than absent.
Where it loses: present is not the same as deep. Langfuse, Braintrust, and LangSmith are built around the loop from a labeled dataset to a repeatable experiment, and a team whose releases are governed by that loop will feel the difference within a week. There is also no open-source or self-hosted route, so the private-infrastructure requirement that leads teams to Phoenix rules Datadog out before any feature comparison starts.
The cost shape deserves its own warning. Pricing rides on an existing platform contract, which makes the marginal cost look small to a team already paying and makes the total look absurd to a team that is not. Buying the Datadog platform to obtain an LLM tracing feature inverts the decision.
Choose Datadog when LLM calls are one service among many and incident response is the job. Choose a specialist when the model is the product and the evaluation loop is the job. We reviewed the documentation rather than running an incident through both, so treat that boundary as a starting hypothesis and not a tested result.
A bake-off beats a six-product demo
| Scenario | First tool to trial | The disqualifying test |
|---|---|---|
| One integrated cloud and open-source path | Langfuse | Confirm the server and SDK versions match, then replay one dataset experiment |
| LangChain or LangGraph already owns the agent loop | LangSmith | Trace non-framework code and verify the dataset handoff is still clean |
| Trace data must stay inside your infrastructure | Phoenix | Run the intended PostgreSQL and authentication setup, not the local SQLite demo |
| Releases are governed by datasets and experiments | Braintrust | Turn a real production failure into a scored regression case |
| The gateway must own cost, routing, and request analytics | Helicone | Export one failure into the external evaluation system you will actually use |
| LLM calls are one service inside an estate you already monitor | Datadog | Trace one failure across model, service, and infrastructure spans without leaving the view |
| Existing OpenTelemetry APM already answers the incident question | Keep it, then add one specialist only if needed | Prove that the new product closes an evaluation or LLM-semantics gap |
We would compare two finalists with the same small workload rather than six products with six demo applications. Instrument one representative RAG or agent path with model, retrieval, tool, and application spans. Include a successful case, a provider error, a bad retrieval, a malformed tool call, a slow response, and a prompt that contains sensitive text that must be redacted.
Then run this sequence:
- Send the same trace shape to both products and check whether parent-child relationships survive.
- Find the bad retrieval without knowing its trace ID.
- Convert that failure into a labeled dataset case.
- Run one code-based evaluator and one human review pass.
- Compare a changed prompt against the original cases.
- Export the data, estimate the production billing unit, and rehearse deletion.
Record setup time, missing spans, time to isolate the failure, evaluator reproducibility, redaction behavior, data export, and monthly cost at the expected volume. Do not use the vendor's sample chatbot as the test workload. It has already been arranged to make the vendor's happy path happy.
This article has not run that bake-off. Until it does, the verdict is about documented workflow and deployment fit, not runtime quality.
The loop is the product, not the trace store
Observability begins before deployment. The RAG model guide helps choose the generation layer, but a production trace must also show retrieved document identifiers, ranking or filtering steps, tool calls, and the final answer. Otherwise a groundedness failure looks like a model failure even when retrieval supplied the wrong evidence.
The deployment guide covers runtime boundaries such as secrets, timeouts, streaming, and background work. Add the trace exporter to that design before traffic arrives, and make sure it flushes under the actual serverless or worker lifecycle. A local span that never leaves the process is comforting but not observable.
Model tokens remain a separate cost layer. Use the LLM pricing comparison for provider rates, then add observability ingestion, evaluator model calls, retained data, and the people reviewing failures. The cheapest trace store can become the expensive choice if nobody can turn a production miss into a regression test.
The trace store is the commodity. The loop from production failure to repeatable test is the product, and it belongs to whichever tool your team will actually close it in.
Reader questions
Frequently asked questions
01What is the best LLM observability tool in 2026?
Langfuse is our July 28, 2026 pick when one product has to cover traces, datasets, evaluations, and an MIT-licensed self-hosted path. LangSmith is cleaner inside LangChain or LangGraph. Phoenix keeps data in a private OpenTelemetry stack. Braintrust is built around experiments. Helicone watches the gateway. Datadog belongs beside an existing estate.
02What should an LLM observability tool capture?
One request should produce a single nested trace: model, retrieval, tool, guardrail, and application spans together. Store model IDs, timings, tokens, cost, errors, prompt or app versions, user feedback, and scores. Strip secrets and personal data before anything leaves the process. Keep enough of the original context that a later reviewer can reproduce the failure.
03Do I need LLM observability before I have production traffic?
If the app already chains models, retrieval, or tools, start tracing in development. Missing context and broken tool paths show up there. A small labeled dataset will catch a regression before anyone is on-call for it. Live traffic later supplies real failures. It should not be the first time anyone can see the path.
04Which LLM observability tools can I self-host?
Langfuse and Phoenix both publish open-source self-hosting guides. LangSmith self-hosted and hybrid deployments sit on the enterprise path. Braintrust lets you run the data plane while it keeps the control plane. Helicone lists on-premises only on enterprise. Read the current deployment docs before you treat any of those as a weekend install.
05Is Datadog good for LLM observability?
For a team already on Datadog, model spans can sit next to the service, queue, and host traces that page people at night. That correlation is the win. There is no self-hosted route, and the dataset-to-experiment loop is thinner than Langfuse, Braintrust, or LangSmith. Buy it to join timelines, not to run an evaluation lab.
06Is LLM observability the same as evaluation?
Observability writes down what a request did: calls, spans, inputs, outputs, timing, errors, and metadata. Evaluation scores whether the result was acceptable. The useful products join those jobs, so a failed production trace can be labeled, dropped into a dataset, and replayed as a test before the next release.
Source ledger
External sources linked in this article
- 01Langfuselangfuse.com
- 02LangSmithdocs.langchain.com
- 03Phoenixarize.com
- 04Braintrustbraintrust.dev
- 05Heliconedocs.helicone.ai
- 06Datadogdocs.datadoghq.com
- 07evaluationsdocs.datadoghq.com
- 08Langfuselangfuse.com
- 09LangSmithlangchain.com
- 10Arizearize.com
- 11Braintrustbraintrust.dev
- 12Heliconehelicone.ai
- 13Datadogdatadoghq.com
- 14evaluation conceptslangfuse.com
- 15self-hosted pricinglangfuse.com
- 16billable unitslangfuse.com
- 17version compatibility pagelangfuse.com
- 18offline and online evaluationdocs.langchain.com
- 19self-hosted LangSmithdocs.langchain.com
- 20deployment architecturearize.com
- 21privacy documentationarize.com
- 22observability documentationbraintrust.dev
- 23evaluation workflowbraintrust.dev
- 24OpenTelemetry exportbraintrust.dev
Share or save